Jira Dashboards: Maximising Project Efficiency and Collaboration
Jira Dashboards serve as a central hub for tracking project progress and managing tasks within a team. They provide team members with a visual representation of their work, allowing them to monitor the status of issues and tasks, identify bottlenecks, and make informed decisions about prioritising work. Customisable and versatile, Jira dashboards offer a high level of adaptability to fit the specific needs of different projects and teams. With a variety of pre-built and customisable gadgets, users can create a tailored dashboard that highlights the most important data and metrics for their organisation.
|
The process of creating and customising a Jira Dashboard involves various steps, such as selecting the appropriate gadgets and filters to display meaningful data, organising the layout for optimal efficiency, and adjusting settings to match the audience’s preferences. When setting up a dashboard, it’s essential to consider the needs of the team members and stakeholders who will be using it – ensuring the information is presented accurately and is actionable for its target audience.
Advanced features and best practices play a crucial role in creating an effective and efficient Jira Dashboard. By leveraging these capabilities, users can create highly customised dashboards that offer deeper insights and an enhanced user experience. With a well-designed dashboard, teams can adopt a more agile approach to project management and navigate their work more efficiently.
Key Takeaways
- Jira Dashboards offer a centralised, customisable hub for teams to track project progress and manage tasks effectively
- The process of creating a dashboard involves selecting appropriate gadgets, filters, and layout to present accurate and actionable information
- Utilising advanced features and best practices can improve user experience and promote agile project management.
Overview of Jira Dashboards
Jira Dashboards serve as a centralised workspace for teams to visualise and organise their project information, metrics, and reports. They consist of customisable gadgets that display real-time data from various projects within the Jira system. This not only aids in tracking and managing work but also promotes collaboration and informed decision-making.
When it comes to dashboards, Jira users can create multiple variations designed to cater for different purposes and teams. Setting up a personal dashboard helps keep track of individual assignments and issues being worked on. Dashboards can also be shared with other team members, ensuring visibility and transparency throughout a project’s lifecycle.
There is a wide range of gadgets available within Jira’s dashboard system. Some of the most commonly used gadgets include:
- Sprint Health Gadget: Provides a high-level view of sprint progress and potential impediments. [1].
- Issue Statistics Gadget: Visualises issue data, such as issue types or priority, through charts.
- Filter Results Gadget: Displays a custom list of issues that meet specified criteria.
- Assigned to Me Gadget: Provides an overview of issues assigned to a particular user.
To create a new Jira dashboard, one can follow these simple steps:
- Click on “Dashboards” in the main navigation bar.
- Choose “Create Dashboard” in the dropdown menu.
- Give it a meaningful name and description.
- Select the desired visibility settings (private or shared).
Once the dashboard is created, users can add and customise gadgets by following the “Add gadgets” link within the dashboard. It is crucial to select only the most relevant and useful gadgets for your specific needs, ensuring clarity and focus on pertinent information.
In conclusion, Jira Dashboards provide a flexible and customisable solution for teams to monitor, track, and manage their projects with ease. The integration of gadgets enables users to tailor the dashboard based on their requirements, ultimately promoting efficient project management in an accessible and organised manner.
Customising Jira Dashboards
Jira dashboards are a powerful tool for managing and monitoring projects. By customising your dashboard, you can tailor it to display the most relevant information for your team’s needs. This section will cover two essential aspects of customising Jira dashboards: adding and removing gadgets, and sharing dashboards with teams.
Adding and Removing Gadgets
Gadgets are the building blocks of Jira dashboards. They allow you to display project data, summaries, and other valuable information. To add a gadget to your dashboard, click the Add Gadget button. You’ll then be able to browse a range of available gadgets and select the ones you find most useful. Some popular gadgets include Filter Results, Created vs Resolved Chart, and Issue Statistics.
After adding gadgets, you can customise them by adjusting their settings, such as selecting specific data sources or groupings. Don’t forget you can rearrange the gadgets’ positions on the dashboard using drag-and-drop functionality for optimal visibility.
To remove a gadget, simply click on the Actions (•••) menu in the top right corner of the gadget and select Delete.
Sharing Dashboards with Teams
Collaboration is key when it comes to managing projects in Jira. Sharing your customised dashboard with your team or specific team members ensures that everyone can access crucial project information. To share your dashboard, follow these steps:
- Click … in the top right corner of the dashboard.
- Select Share Dashboard.
- Choose the sharing method: with a specific person, project, or group.
- Enter the details of the recipient(s) or choose a project or group from the provided list.
- Click Share.
By sharing your dashboard, you ensure that your team stays aligned and informed about project progress and important updates. Keep in mind that only Jira admins can customise the default dashboard, but anyone can create their own custom dashboard and share it with their teams. For more information on creating and customising dashboards, visit this Atlassian Support page.
Dashboard Gadgets
Jira Dashboards provide users with an overview of their projects and tasks using various Dashboard Gadgets. These gadgets can be customised to display relevant information for each user, making it easy to keep track of progress and identify areas for improvement. In this article, we’ll focus on three essential gadgets for Jira Dashboards, namely Issue Statistics, Sprint Health, and Control Chart.
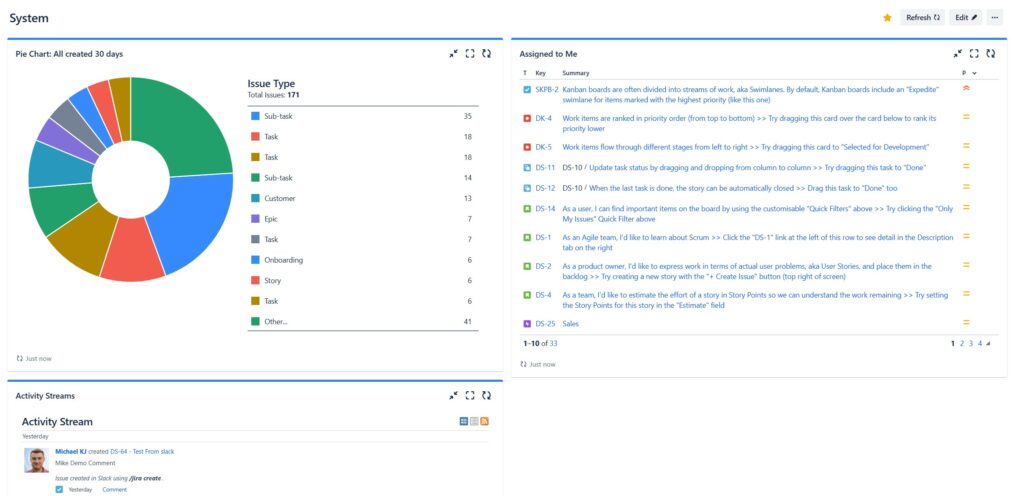
Issue Statistics
The Issue Statistics Gadget is a versatile and powerful gadget that summarises the number of issues in a project or filter based on a chosen statistic type, such as status, priority, or assignee. It provides a quick visual representation of the project’s overall progress. Some key features of the Issue Statistics Gadget include:
- Displaying issue counts based on selected statistic types
- Customisable display options, e.g. pie chart, bar chart, or table
- Filterable data to focus on specific issues or projects
Some example use cases for the Issue Statistics Gadget are:
- Tracking the number of open, in progress, and closed issues
- Identifying bottlenecks by seeing how many issues are assigned to each team member
- Analysing the distribution of issue priority levels
Sprint Health
The Sprint Health Gadget is specifically designed for Agile teams using the Scrum framework. It monitors the progress of a sprint, providing a clear view of its health and the likelihood of achieving sprint goals. It displays key information such as completion percentage, remaining work, and sprint completion forecast. This gadget helps teams to:
- Monitor sprint progress at a glance
- Identify potential risks or problems that could impact a sprint
- Make real-time decisions to improve sprint performance and outcome
The Sprint Health Gadget includes the following information:
- Sprint completion: displayed as a progress bar, this shows the percentage of completed work compared to total sprint scope
- Remaining work: displayed in days, this indicates the collective amount of effort left to complete the sprint
- Sprint completion forecast: an estimation based on historical data, this forecast indicates whether the sprint is on track to finish by its end date
Control Chart
The Control Chart Gadget provides valuable insights into a team’s performance by displaying the distribution of issue cycle times or lead times. It analyses historical data to determine trends and identify process improvements. The Control Chart Gadget allows teams to:
- Understand patterns and trends in issue cycle times
- Identify areas for process improvements and increased efficiency
- Make data-driven decisions to improve team performance
Control Charts include the following components:
- Cycle time: the time it takes for an issue to go from “In Progress” to “Done”
- Lead time: the time it takes for an issue to go from “To Do” to “Done”
- Moving average: a trendline that helps visualise performance over time by smoothing out variations in the data
In conclusion, these Dashboard Gadgets are essential for Jira users to effectively track and manage their projects. By utilising Issue Statistics, Sprint Health, and Control Chart gadgets, teams can gain valuable insights, identify areas for improvement, and make informed decisions to ensure project success.
Best Practices for Dashboard Management
Regular Updates
It is crucial to keep your Jira dashboards updated frequently. Regular updates ensure that your team has access to the most recent information, which helps with decision-making and prioritising tasks. To achieve this, consider implementing the following strategies:
- Automate data syncing: Use Jira automation to sync data with other sources at predefined intervals, maintaining the relevance and accuracy of your dashboard data.
- Schedule reviews: Encourage team members to review and update their tasks periodically, updating estimates and progress as necessary.
- Use dynamic filters: Instead of using static filters that require manual updates, opt for dynamic filters wherever possible to reflect real-time changes in your data. For instance, you can utilise the ‘Filter Results‘ gadget in Jira to display filtered data automatically.
Access Permissions
Managing access permissions plays a vital role in ensuring the security and confidentiality of your Jira dashboards. Follow these best practices for access permissions to prevent unauthorised access and maintain data privacy:
- Assign user roles: Rather than granting individual permissions, assign roles to users (such as team members, managers, or stakeholders) and then grant dashboard access based on those roles. This simplifies the permission management process and ensures consistent access across all users in a role.
- Restrict project-level access: Limit access to specific projects by employing project-level permissions. For example, you might grant read-only access to stakeholders while giving read-write access to team members.
- Review permissions periodically: Regularly review access permissions to ensure they remain up-to-date. As team members join, leave, or move within your organisation, their access rights may need to be updated or revoked.
By following these best practices for Jira dashboard management, you can ensure that your dashboard remains a reliable, effective tool for managing your projects and providing valuable insights for your team.
Advanced Dashboard Features
Jira Dashboards offer a wide range of advanced features that can help users monitor their projects and stay informed about their teams’ progress. In this section, we’ll explore two of these advanced features: Dashboard Subscriptions and Integration with Confluence.
Dashboard Subscriptions
Dashboard subscriptions allow users to receive regular updates on their Jira dashboard via email. This feature helps team members stay informed about important changes in their projects without constantly needing to check their dashboards. Users can subscribe to their own dashboards as well as other users’ shared dashboards. To set up a dashboard subscription:
- Navigate to the desired dashboard
- Click on the ellipsis (three dots) in the top right corner
- Select Subscribe
- Choose the frequency of updates: Daily, Weekly, or Monthly
- Select the preferred delivery time
- Click Add to save the subscription
With dashboard subscriptions, users can stay up-to-date on project developments and make timely decisions based on the most recent data.
Integration with Confluence
Jira’s integration with Confluence, another Atlassian product, provides users with the ability to display relevant project information from Confluence directly to their Jira dashboards. This powerful feature allows for seamless collaboration between teams and streamlines the exchange of information between the two platforms. To add a Confluence page to a Jira dashboard:
- Click on “Add Gadget” in the desired dashboard
- Search for the “Confluence Page” gadget and click Add gadget
- In the configuration panel, enter the URL of the Confluence page that you want to display
- Choose the desired display options such as width and height
- Click Save
By integrating Confluence with Jira Dashboards, teams can efficiently share knowledge, collaborate on documents, and keep track of project updates all in one place.
These advanced dashboard features not only enhance the functionality of Jira Dashboards but also contribute to a more streamlined and informed user experience. With Dashboard Subscriptions and Integration with Confluence, teams can effectively monitor their projects and collaborate more efficiently, leading to better project outcomes.
Frequently Asked Questions
How do I add gadgets to my Jira dashboard?
To add gadgets to your Jira dashboard, navigate to your dashboard and click on the “Add gadget” button. A gadget directory will be displayed, allowing you to browse and select gadgets to include. Once you’ve chosen a gadget, click “Add gadget” and it will be added to your dashboard. You can customise the gadget settings and rearrange it by using the drag-and-drop functionality.
What are the steps for creating a Jira dashboard using filters?
- Start by creating a filter in Jira to define the issues you’d like to display on the dashboard. This can be done using JQL (Jira Query Language) or by using the basic issue searcher.
- Navigate to your Jira dashboard and click on “Create dashboard.”
- Provide a name and description for your new dashboard.
- Click on “Add gadget” and search for the “Filter Results” gadget.
- Add the gadget to your dashboard and configure it to use the filter you created in step 1.
- Customise other settings as needed and click “Save.”
Can you customise reports on Jira dashboards?
Yes, you can customise reports on Jira dashboards. Many gadgets in Jira allow you to configure their settings, such as timeframes, number of results shown, and sorting options. Some gadgets also offer different visualisation options, like pie charts, bar charts, and line charts.
Are there pre-designed templates for Jira dashboards available?
Although Jira does not offer pre-designed templates, you can create your own custom dashboard by adding and arranging gadgets that fit your needs. Additionally, you can search the Atlassian Marketplace for third-party add-ons that may offer dashboard templates or additional gadgets.
How does one manage permissions for a Jira dashboard?
To manage permissions for your Jira dashboard, follow these steps:
- Navigate to your dashboard and click on “…” in the top right corner.
- Select “Edit and share dashboard.”
- Choose the “Sharing” tab.
- Decide if the dashboard will be private, shared with specific users, or public within your organisation. Update the settings accordingly, and click “Save.”
What are the distinctions between a Jira board and a Jira dashboard?
A Jira board is a visual representation of a project’s issues, designed to help teams track and manage their work. Boards can be either Scrum, Kanban, or a custom board type. In contrast, a Jira dashboard serves as a centralised overview of projects and issues by displaying various gadgets. Dashboards are often used for monitoring progress, generating reports, and gaining quick insights into different aspects of a project.