

Dashboards are Jira’s biggest underdog—and most teams are missing out.
If you’re jumping between projects, trying to get a big picture view of what’s happening across your organisation, you’re doing it wrong. Dashboards are like the cockpit of an aeroplane—they give you all the critical information you need in one place.
Yet most Jira users either ignore dashboards completely or create one generic dashboard that tries to do everything (and ends up being useful for nothing).
Here’s what you’re missing: properly configured dashboards can replace hours of manual project hopping with a single glance. Whether you’re a Scrum Master tracking multiple teams, a manager monitoring business metrics, or just someone who wants to see their personal workload clearly, dashboards are your answer.
The secret isn’t cramming every possible gadget onto one screen—it’s creating multiple focused dashboards using JQL filters and sharing them strategically across your teams. You can build pie charts that actually matter, filter results that update automatically, and even convert any search query into a dashboard gadget in seconds.
Most people spend maybe 10 minutes setting up a basic dashboard and wonder why it doesn’t help. I’m going to show you how to build dashboards that actually transform how you work with Jira—and why the time you invest upfront will save you hours every week.
Why Dashboards are Essential in Jira? 📊
Dashboards in Jira can be likened to the cockpit of an aeroplane. They provide a comprehensive view of your projects, enabling you to track progress and performance without needing to switch between different projects. This is particularly useful in busy environments where multiple projects are running simultaneously. Here are some key reasons why dashboards are crucial:
- Big Picture Overview: Dashboards allow you to see what’s happening across various projects at a glance.
- Enhanced Reporting: You can utilize dashboards to generate insightful reports that help in project management.
- Collaboration: Sharing dashboards with your team fosters collaboration and keeps everyone aligned with project goals.
Getting Started: Creating Your Dashboard 🛠️
To create a dashboard in Jira, navigate to the dashboards section. If you’re using Jira Cloud, the interface is user-friendly and intuitive. Here’s a step-by-step guide:
- Access the Dashboard Section: Start by clicking on the “Dashboards” tab in the main navigation menu.
- Create New Dashboard: Click on the “Create Dashboard” button. Here, you can give your dashboard a meaningful name. Avoid generic names; instead, opt for something descriptive that reflects its purpose.
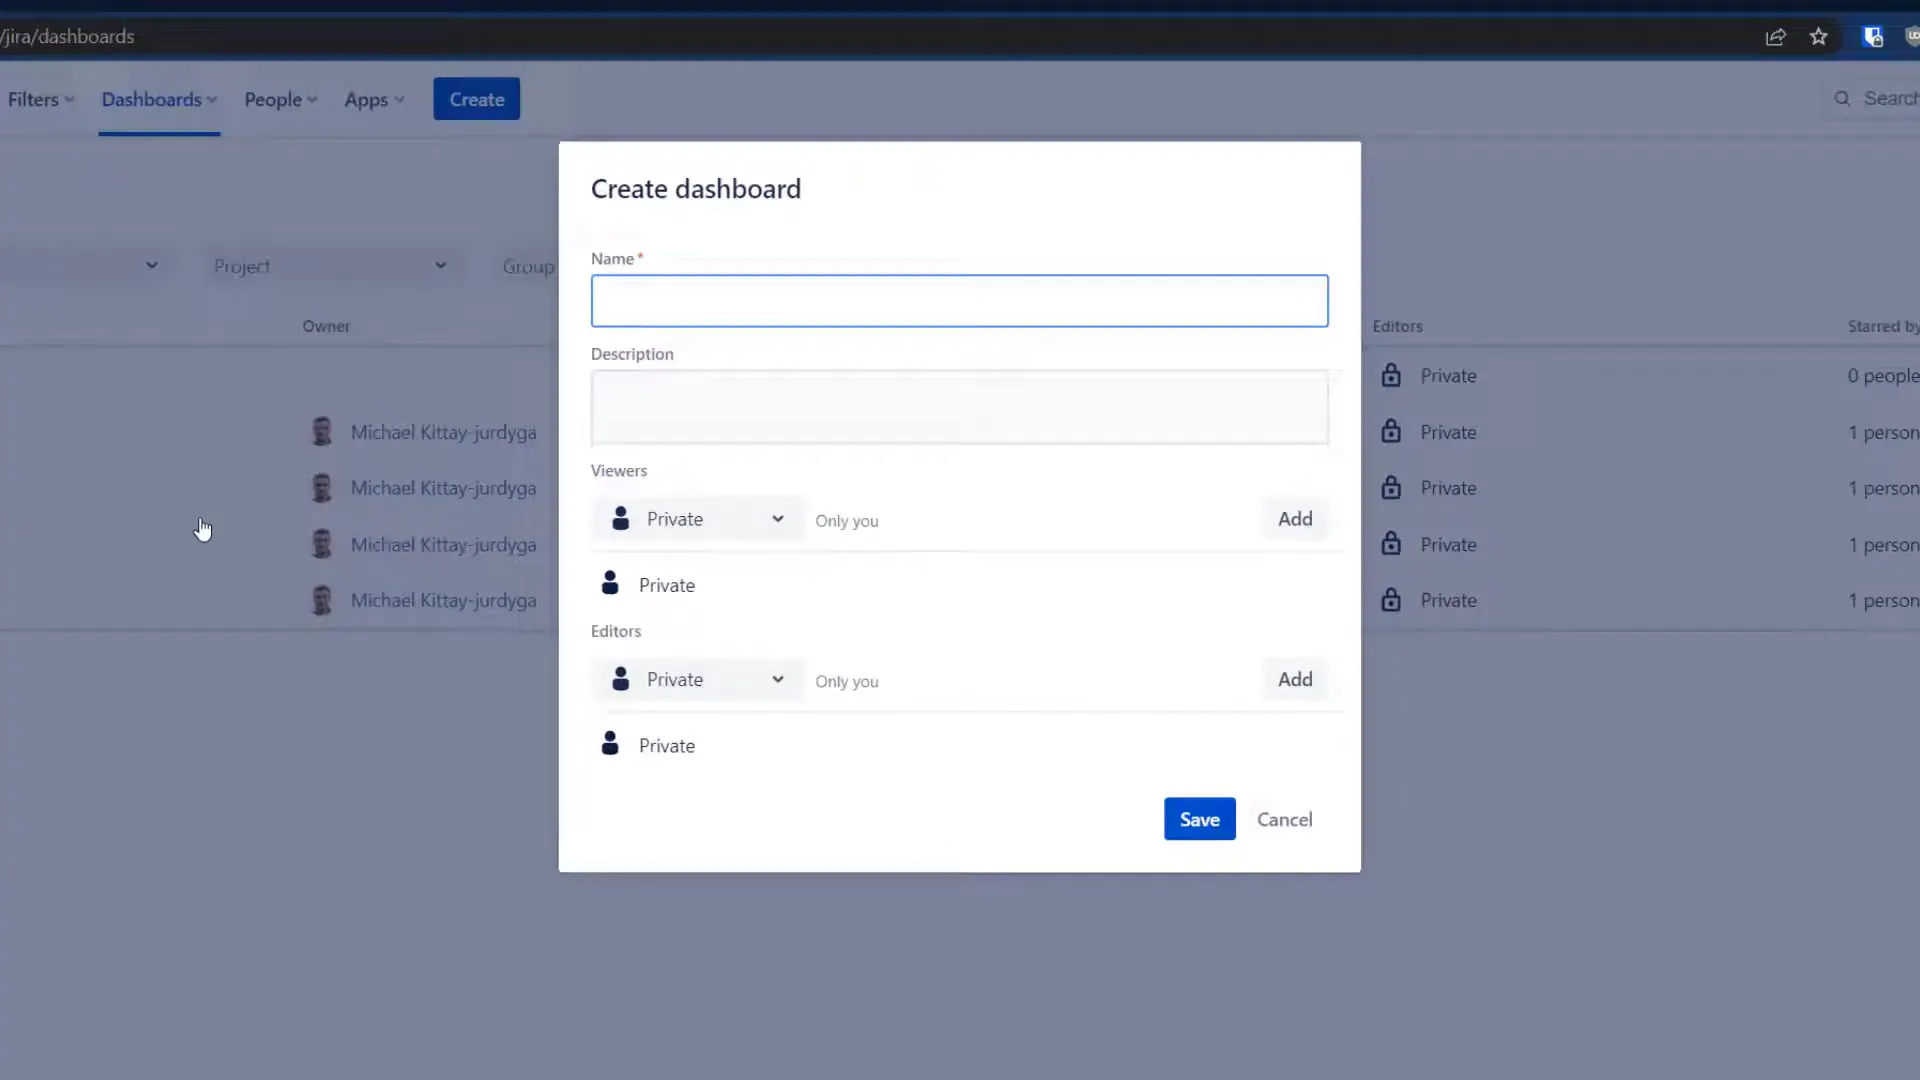
- Set Permissions: You can share your dashboard with your team. Choose whether they can view or edit the dashboard. This is an essential step, especially in a team environment.
Adding Gadgets to Your Dashboard 🧩
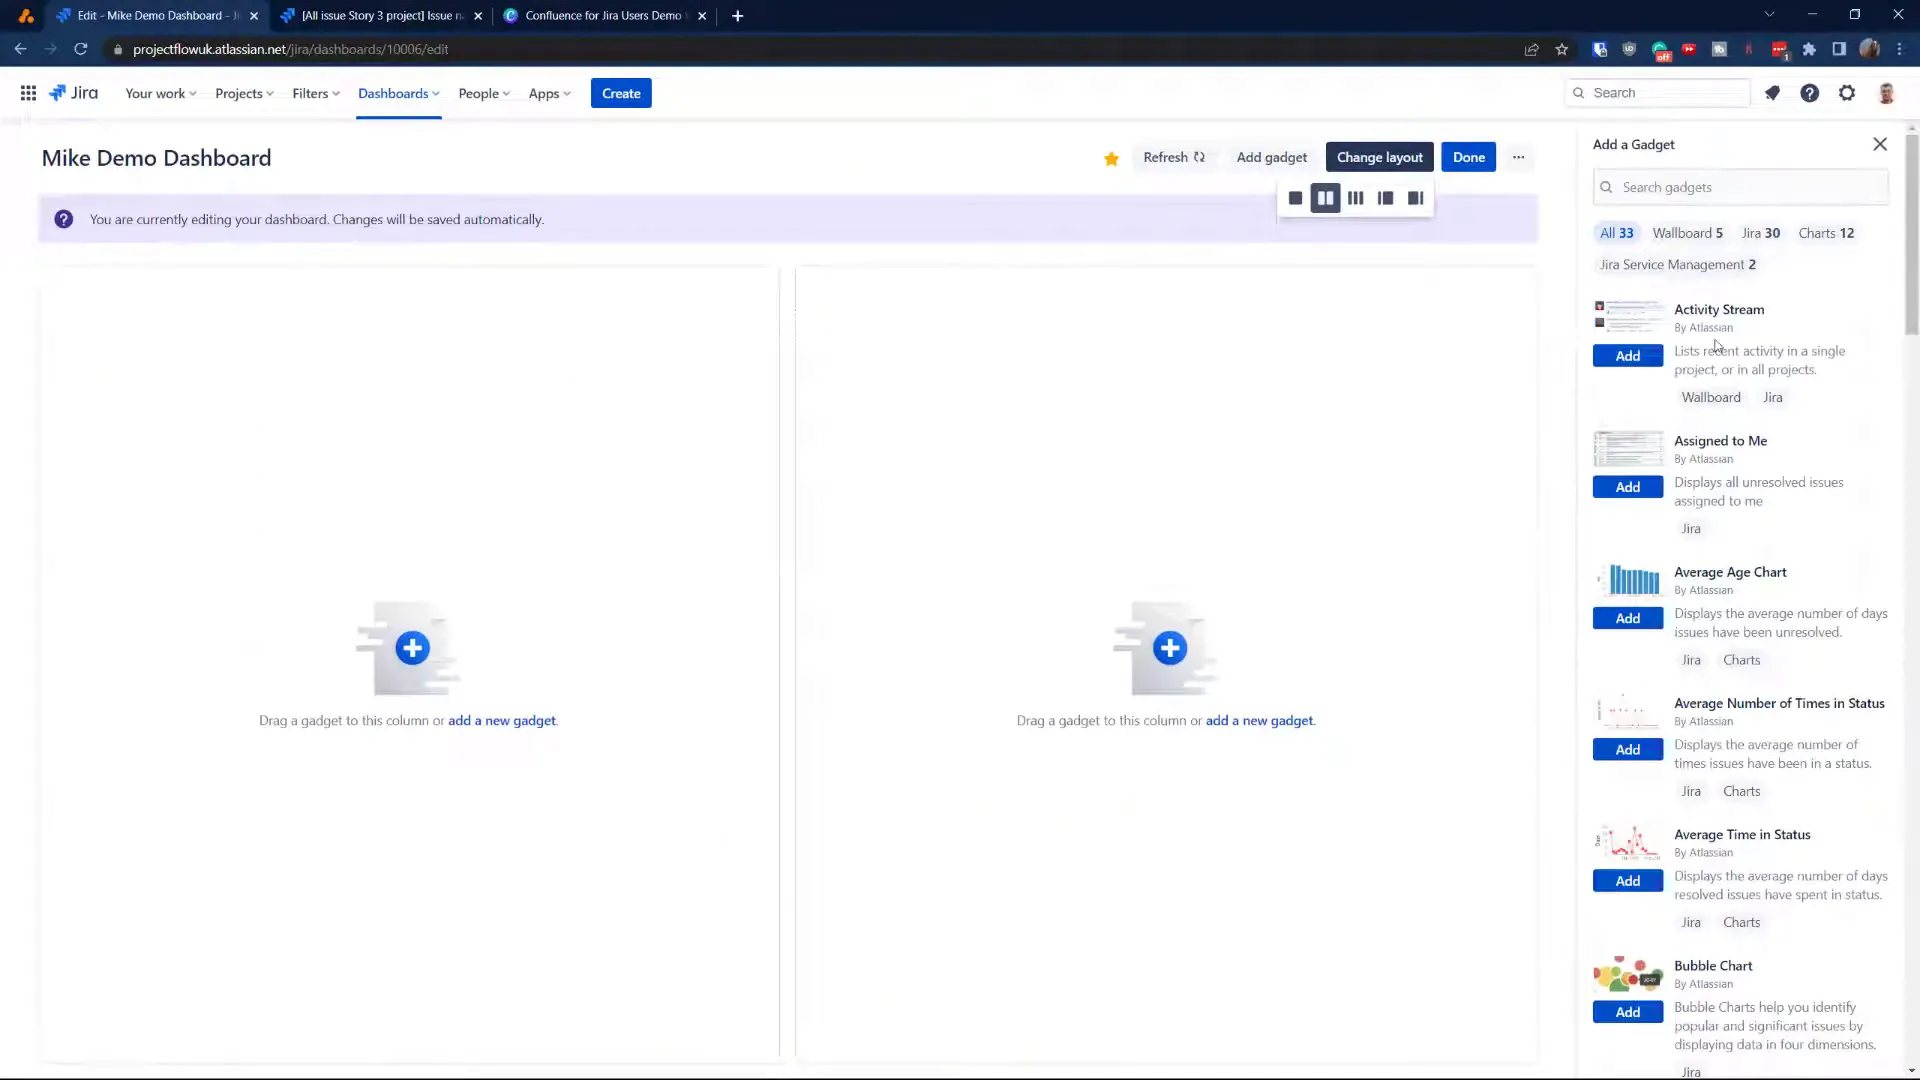
Once your dashboard is created, the next step is adding gadgets. Gadgets are mini-applications that display specific information. Here’s how to add them:
- Click on “Add Gadget”: You’ll find this option on your newly created dashboard.
- Select Gadgets: Choose from a variety of gadgets based on your needs. Popular options include:
- Filter Results
- Pie Charts
- Activity Streams
- Configure Gadgets: After adding them, configure each gadget to display the data relevant to your projects. For instance, if you’re adding a pie chart, select the filters you want to visualise.
Utilising JQL for Custom Filters 🔍
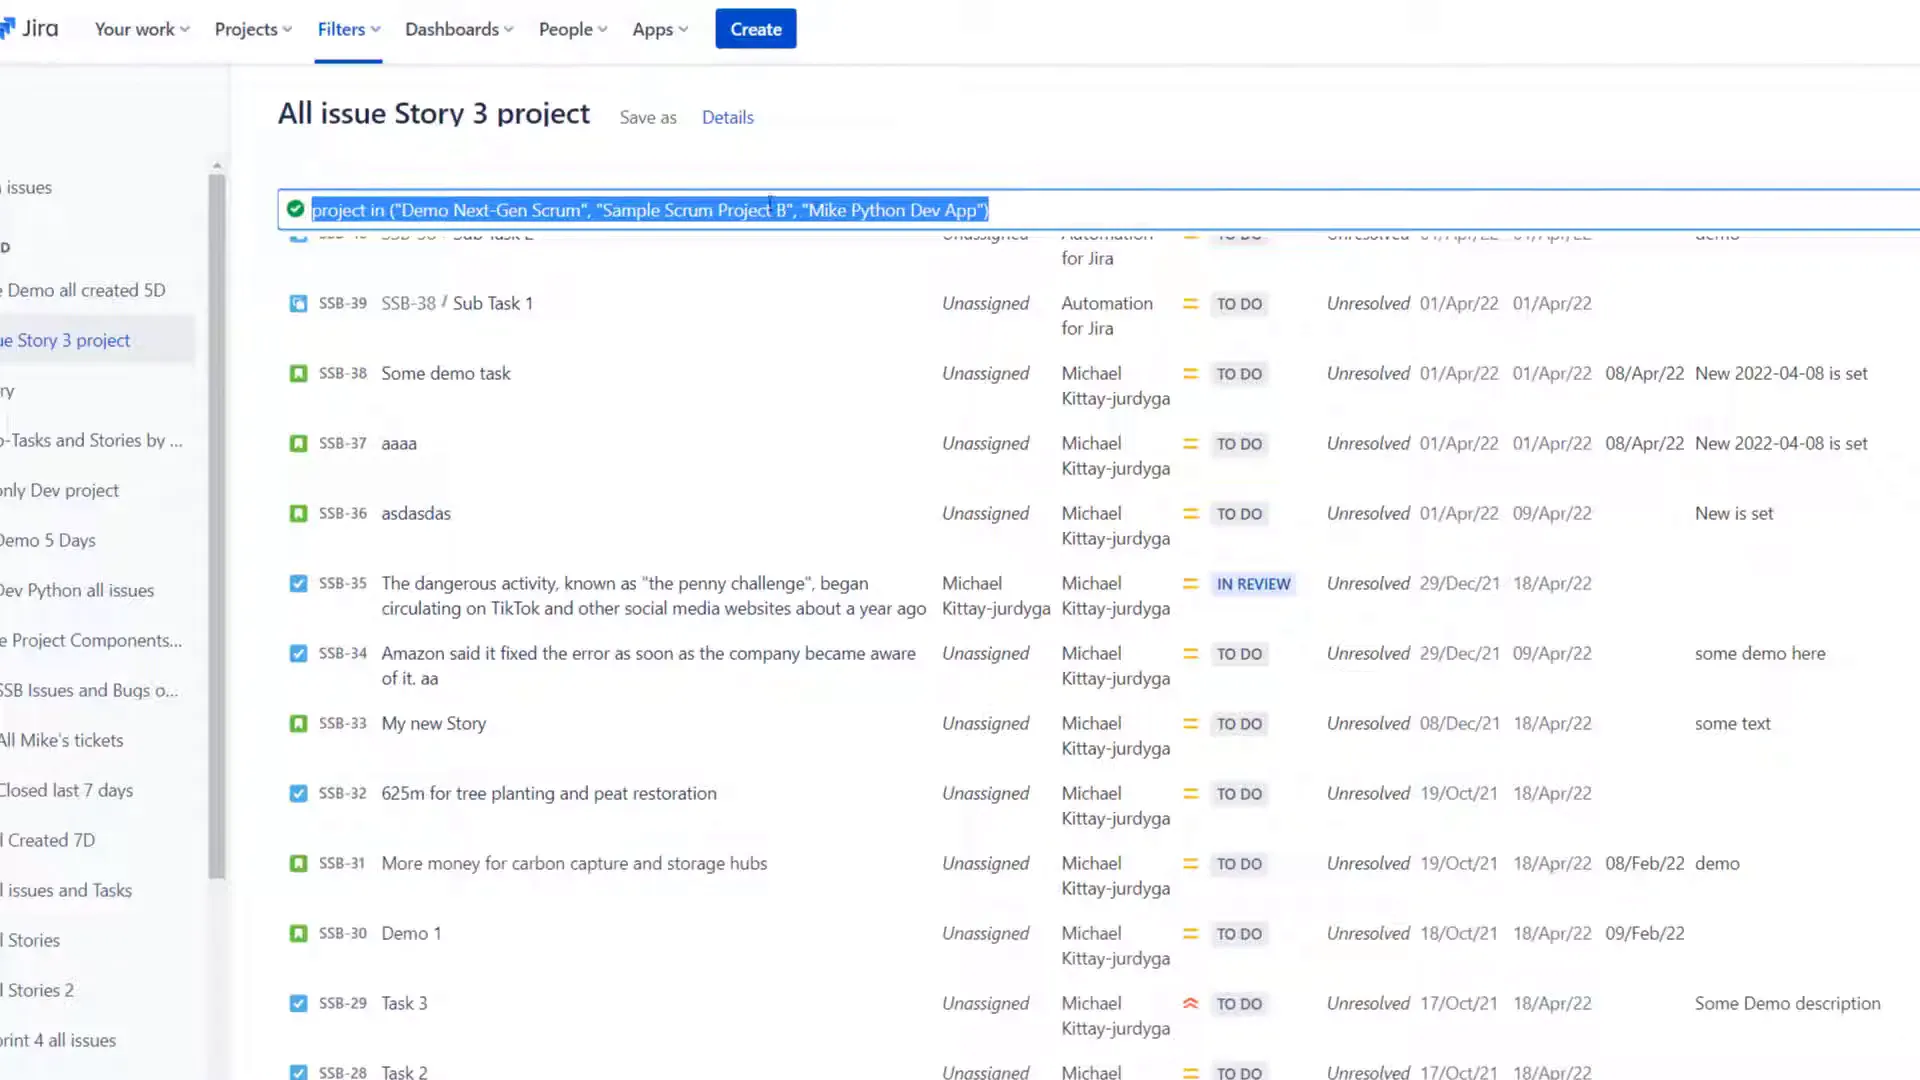
One of the powerful features of Jira is the ability to create custom filters using JQL (Jira Query Language). This allows you to tailor the data displayed on your dashboard. Here’s how to utilise JQL:
- Create a Filter: Go to the “Filters” section and click on “Create Filter.” You can use JQL to define specific criteria, such as issues assigned to a particular user or tasks created within a certain timeframe.
- Save Your Filter: Don’t forget to save it, as this will allow you to use it in your gadgets later.
- Add to Dashboard: When configuring your gadgets, select your saved filter to display the relevant data.
Best Practices for Organizing Your Dashboard 🗂️
To ensure your dashboard remains efficient and user-friendly, follow these best practices:
- Limit the Number of Gadgets: While it’s tempting to add many gadgets, keep it concise. Aim for a maximum of four to six gadgets to avoid clutter.
- Use Meaningful Names: Name your gadgets and filters clearly to make navigation easier for team members.
- Regular Updates: Set your gadgets to refresh at regular intervals to ensure the data displayed is always current.
Sharing Your Dashboard with Team Members 👥
Once your dashboard is set up, sharing it with your team is crucial for collaboration. Here’s how to do it:
- Access Dashboard Settings: Go to the settings of your dashboard.
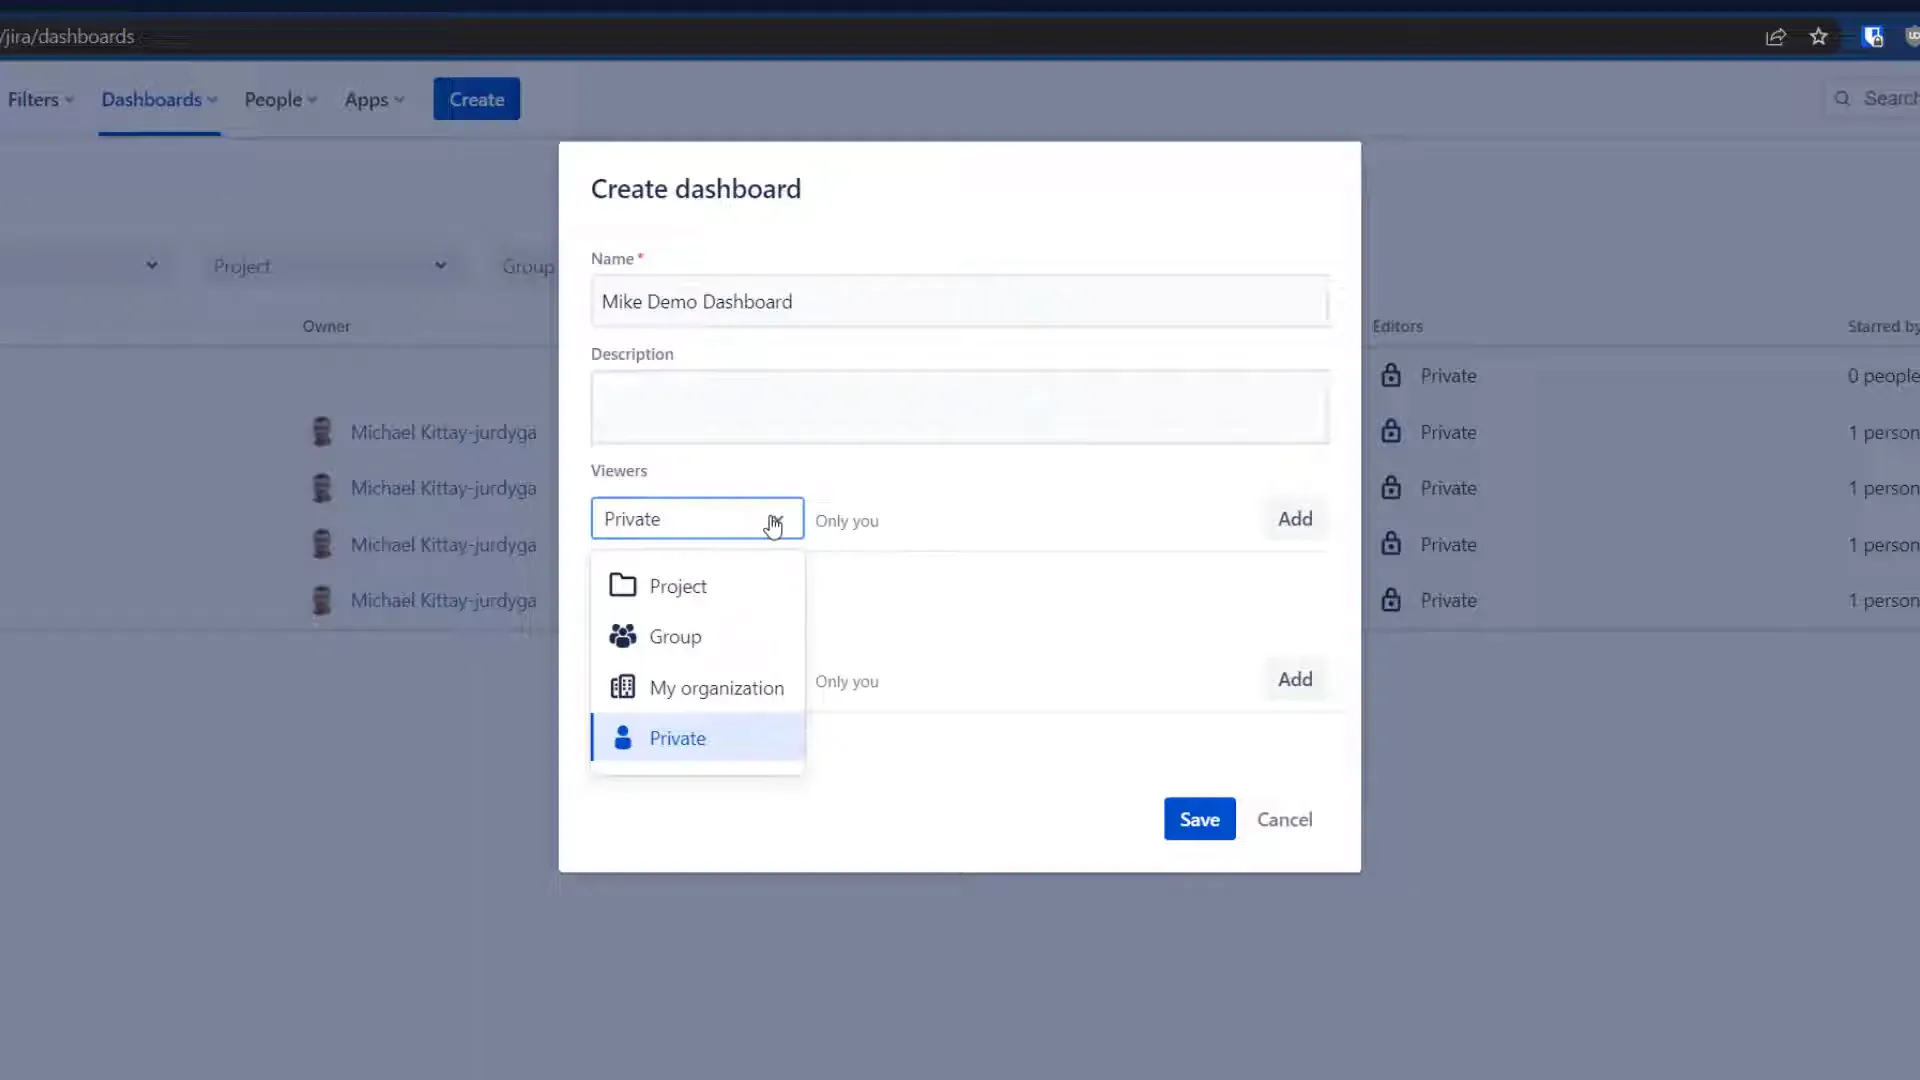
- Select Sharing Options: Choose whether to share it with specific users, groups, or all users in your organization.
- Set Permissions: Decide whether team members can view or edit the dashboard. This is particularly important if you want them to contribute to its content.
Common Mistakes to Avoid ❌
When setting up your dashboard, be mindful of these common pitfalls:
- Ignoring Naming Conventions: Using vague names can lead to confusion. Always opt for descriptive titles.
- Overcomplicating Filters: Keep your JQL queries straightforward. Complex queries can lead to errors and confusion.
- Neglecting User Permissions: Ensure that the right people have access to the dashboard with the appropriate permissions.
FAQs About Jira Dashboards ❓
1. Can I use Jira dashboards for multiple projects?
Yes, you can create dashboards that pull data from multiple projects, allowing you to have a consolidated view of your work.
2. What types of gadgets can I add to my dashboard?
Jira offers a variety of gadgets, including pie charts, filter results, and activity streams, among others.
3. How can I customize my dashboard further?
Utilize JQL to create custom filters that provide specific insights tailored to your needs.
4. Is it possible to share my dashboard with external users?
Sharing options typically depend on your organization’s settings, but you can usually share it with specific users or groups within Jira.
Conclusion: Unlock the Power of Jira Dashboards 🚀
In conclusion, mastering Jira dashboards is essential for anyone looking to enhance their project management skills. By following the steps outlined in this guide, you can create a dashboard that not only provides valuable insights but also fosters collaboration within your team. Don’t forget to experiment with different gadgets and JQL queries to maximize the potential of your dashboards!
If you found this guide helpful, consider checking out more resources from Project Flow Academy. Happy dashboarding!